Short introduction into Wanguard's graph system.
Optimizing Wanguard Graphs
Collecting data is very important, but it is also vital to know what kind of impact this might have on Your Wanguard system. That's why I would like to explain how much data and server load we can put on Wanguard's graph job.
It is crucial to watch our Wanguard server IO Wait times on CPUs, especially under higher system load or during attacks.
IOWAIT is the time during which that CPU was idle (i.e. didn't execute any tasks) and there were at least one outstanding disk I/O operation requests by a task scheduled on that CPU.
Here is a sample screen of Linux top command:
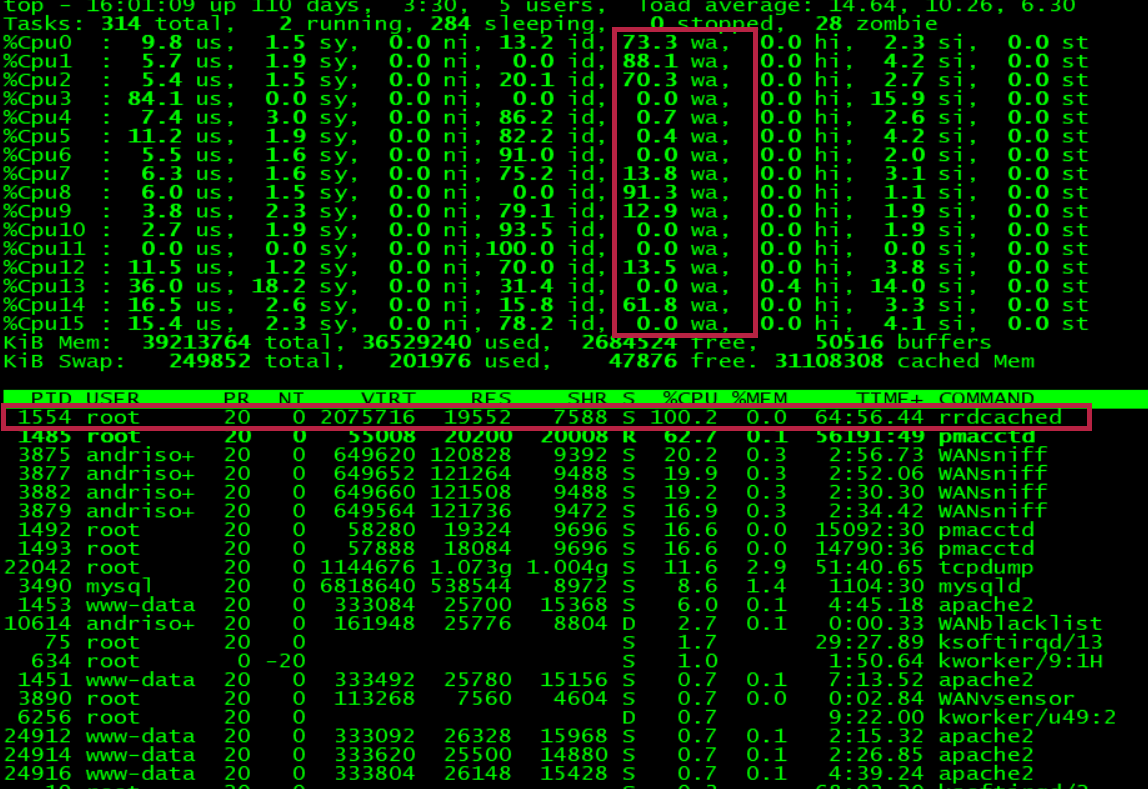
I have highlighted CPU wait times and rrdcached process which is taking 100% CPU, but also it is flushing data from memory to rrd files.
Which can be shown using this command: iotop

When Wanguard server is waiting for all disk operations to be completed, there isn't much room for any other operations to happen in that time such as analyzing DDoS attack and putting a response in motion. That's why it is crucial to sacrifice graphing over response time.
Graphing can be fine-tuned using SSD disk and rrdcached, but those features might not be enough when dealing with massive amounts of graphs.
Here is a Wanguard graph settings page under: [Configuration> Network & Policy > [Your IP Zone name]
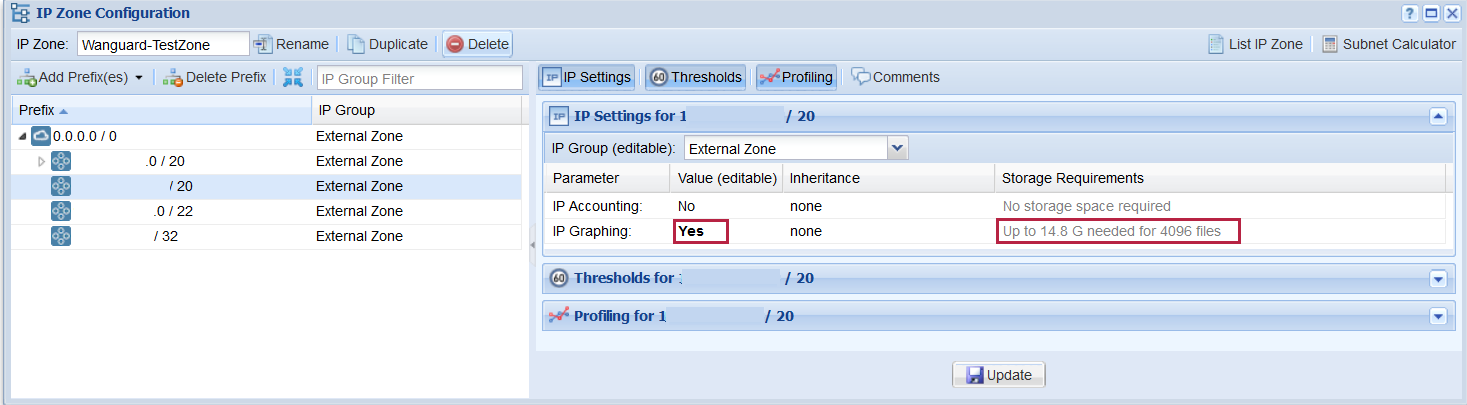
Under this section, we can control how many graphs will be created per prefix. I recommend to add more specific prefixes and graph only those which are absolutely necessary. As we can see here that graphing a /20 subnet (4094 IPs) will create 4096 files and will occupy 14.8 GB of data, which will be flushed to disk according to graph timespan ( 5 minutes) or rrdcached setting.
There is also another setting in Wanguard for controlling how much space each rrd file take, this can set under:
[Configuration > General Settings >Graph & Storage]
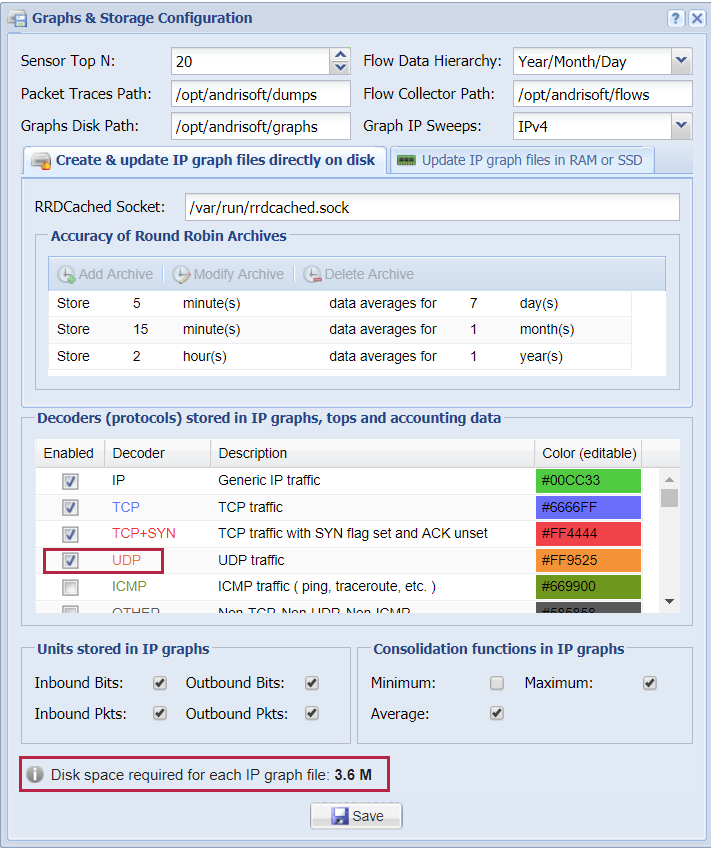
When adding each Decoder / protocol or defined variable we add additional data to every graph, this is a global setting which will be set for all graphs per IP.
Sample calculations, for each decoder we need 0.6 MB
4096 graphs x 3.6 MB = 14.8 GB
4096 graphs x 4.2 MB = 17.2 GB
4096 graphs x 4.8 MB = 19.8 GB
Summary
Each graph must be written or flushed to disk, so for this operation, we need 1 IOPS (1operation) to complete. When graphing large amounts of IP or subnets, it's a good practice to put graphs on a separate SSD drive or even Fusion-IO drive.
Additional information:
IOPS - https://en.wikipedia.org/wiki/IOPS A quick table on the bottom will present drives and their IOPS.